

Miscellaneous Python Resources
Dr. Phillip M. Feldman
console_input.pyThis module defines several general-purpose functions:
Python's Standard Library provides a rather minimal capability for
reading input interactively from the console (standard input). The functions
get_bool, get_int, get_float, and
get_str facilitate such input, providing user input type checking
and allowing the calling program to specify optional value checks.
The function make_check generates a function as its
output; the generated function tests a value against an arbitrary condition,
and can be passed to any of the above input functions.
The function str2int converts a string to an integer, with
somewhat more flexible rules for input formatting than those imposed by
Python's int function.
CustomImporter.pyCimport and
Cfrom—that are similar to but slightly more flexible than
Python's built-in import and from commands,
respectively, as well as several ancillary functions. The behavior of
Cimport and Cfrom differs from that of their built-in
counterparts as follows:
import_path are searched subsequently.
The module name may be fully-qualified, in which case no search is performed.
import_path can be set by calling the
setpath function; by default, the contents of
import_path are the same as those of sys.path (the
Python path).
import xyzNew:
   from CustomImporter import Cimport
   xyz= Cimport('xyz')
import A as BNew:
   from CustomImporter import Cimport
   B= Cimport('A')
from xyz import abcNew:
   from CustomImporter import Cfrom
   abc= Cfrom('xyz', 'abc')
from A import B as CNew:
   from CustomImporter import Cfrom
   C= Cfrom('A', 'B')
   from CustomImporter import Cimport
   C= Cimport('A', in_folders=['C:/Audio', 'C:/Video'], as_name='B')
In this last example, the call to Cimport causes it to search for a
module called A in the two specified folders, and if it is not
found there, in sys.path. If the module is found, it will be loaded
and stored in sys.modules under the key 'B', with a reference being
stored in C.
prefixes1.py and prefixes2.pyThese scripts process a spelling dictionary to identify commonly-occurring
prefixes. For our immediate purposes, their value is in demonstrating many of
the fundamentals of Python, including file input, looping, string operations,
and operations involving lists and sets. Note that Python's for
loop operates on elements of a list, much like Perl's
foreach loop.
primes.pyThis Python module contains functions for performing various calculations involving prime numbers, including primality testing, prime factorization, and the like. From the standpoint of learning Python, it demonstrates several things:
log_round is
particularly interesting because it can operate on either a scalar (single
value) or at one shot on an entire array of values. (The latter is much more
efficient than invoking the function repeatedly within a loop). Also, the
ability to write a single Python function that operates on inputs having any
of several types if extremely powerful.matplotlib. (One of the
functions generates bar graphs with overlaid curves).Type.pyPython permits one to create hierarchical data structures with arbitrary
nesting. (Data structures may even be recursive, in which case the depth of
nesting is infinite). Although hierarchical data structures are extremely
powerful, they can also be hard to understand. The module Type.py
defines a function called Type that recursively explores an object
to display information about data types at various levels in the hierarchy.
This function can be used in any of several ways:
For those who are new to Python or NumPy, it can be used as a learning tool.
It can be useful when debugging code.
It can be used for checking the types of inputs to functions and methods that you write. (It is good practice to check the types of inputs to your functions when an unexpected input type could produce either misleading results or failure of the code).
It is a good illustration of recursive programming.
The following example demonstrates the use of Type. I define two
data structures and apply the function to each. The first data structure is a
list containing two integers and one float value. The second, more complex data
structure is a dictionary whose values are a list and a nested dictionary.
In [1]: from Type import *
In [2]: x= [1, 2, 3.3]
In [3]: Type(x)
Out[3]: 'list[float,int]'

In [4]: x= {'A':[1,2,3], 'B':{'bb':2.2, 'cc':3.3}}
In [5]: Type(x)
Out[5]: 'dict[dict[float],list[int]]'
fit_cubic.pyThis script demonstrates how to solve a small system of nonlinear equations numerically using Python and SciPy, as well as how to perform basic operations on polynomials. The script does the following:
(1) It uses one of SciPy's root solvers to find the cubic polynomial p(x) such that the polynomial and its derivative q(x) have specified values for two values of x.
(2) It plots the resulting polynomial. Inputs are hardwired into the code; one can modify them by editing Section 2.
quantile_regression_demo.pyMost of us are familiar with the charts that pediatricians use that show percentiles of weight and height as a function of age; generating such a chart from a small sample of data requires quantile regression or similar methods. (When working with a large enough sample of data, one can bin the data, i.e., divide the x-axis into intervals and calculate percentiles independently for each interval. But, this approach uses the data inefficiently and is unworkable when sample sizes are small).
Quantiles and percentiles are the same except for a factor of 100, e.g., the 30th percentile is the 0.3 quantile.
This Python script demonstrates that one can perform quantile regression using only Python, NumPy, and SciPy. The only other dependency is on matplotlib, which is used to plot the data and the quantile estimates.
In detail, the script does the following:
(1) Model parameters are assigned. (Currently, these are hardwired into the code).
(2) The program generates an artificial bivariate sample of data (x, y) as follows:
- x is generated by drawing from a distribution that is uniform on [x_min, x_max], where x_min and x_max are currently 0 and 1, respectively.
- y is then generated according to a normal distribution having mean -0.5 + x and standard deviation 1.0 + 0.5 * x.
(All of this can be changed, e.g., one could choose to make the mean of y quadratic in x).
(3) The code defines an objective function based on the tilted absolute value function (see references for motivation).
(4) The SciPy optimization package is then used to optimize (minimize) the objective function.
(5) Using the matplotlib module, the code plots a scatter diagram of the data with an overlay of percentile lines.
Note: Artificial data samples are an excellent way to verify that a statistical algorithm works under ideal conditions, and to explore robustness, i.e., algorithm behavior when standard assumptions such as Gaussianity and independence are (slightly) violated.
Additional notes can be found in the source code.
Many Python applications work across platforms such as 64-bit Windows, 32-bit Windows, and 64-bit Linux without any special effort being taken to achieve platform independence. There are situations, however, where achieving compatibility across multiple platforms requires care. Here are a few considerations to keep in mind:
Linux uses forward slashes to separate the components of a file/folder
path, while Windows (unfortunately) uses backslashes. To assemble a path that
will work across Linux and Windows, use either os.path.sep or
os.path.join().
Linux distinguishes between upper- and lower-case characters in file names, while Windows does not.
There are some situations where one must check the operating system environment and then branch accordingly in the code. I recently encountered such a situation when writing a Python script to compile Cython source code to create a shared object. Different compiler flags are required depending on the target OS, which is assumed to be the same OS that one is currently running. Identifying the OS is not difficult, but is made even easier by the following function.
OS.pyMy OS module defines a single function having the same name as
the module. OS() returns a length-3 list of strings identifying
the operating system environment:
the OS family name as returned by platform.system, e.g.,
'Windows' or 'Linux'.
the OS release (major version identifier) as returned by
platform.release, subject to the following possible modification:
If a matching key appears in the release_dict dictionary (see the
code), the version name will be replaced by the dictionary value. This
dictionary is easy to customize.
the OS word length in bits--either '32' or '64'.
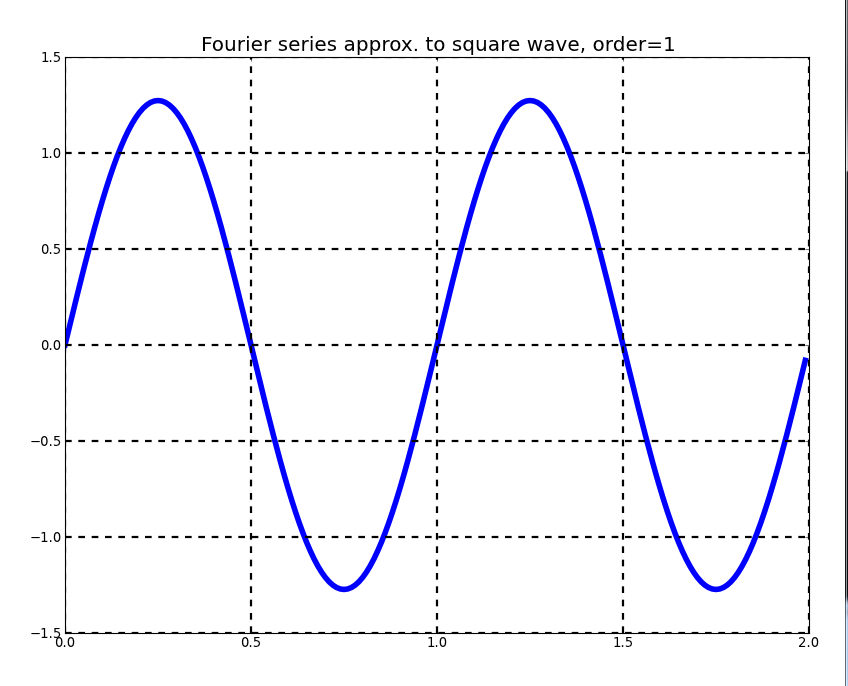
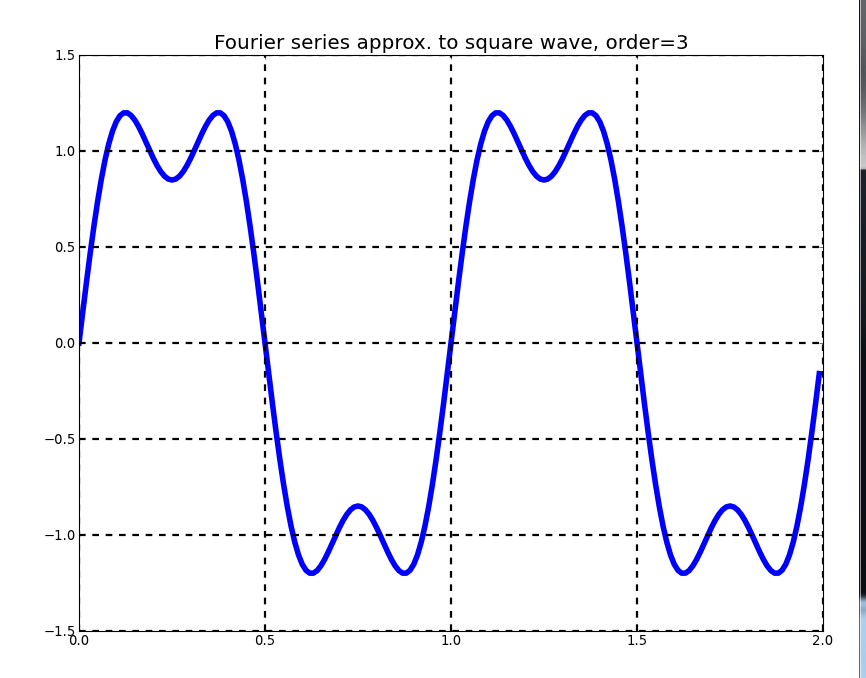
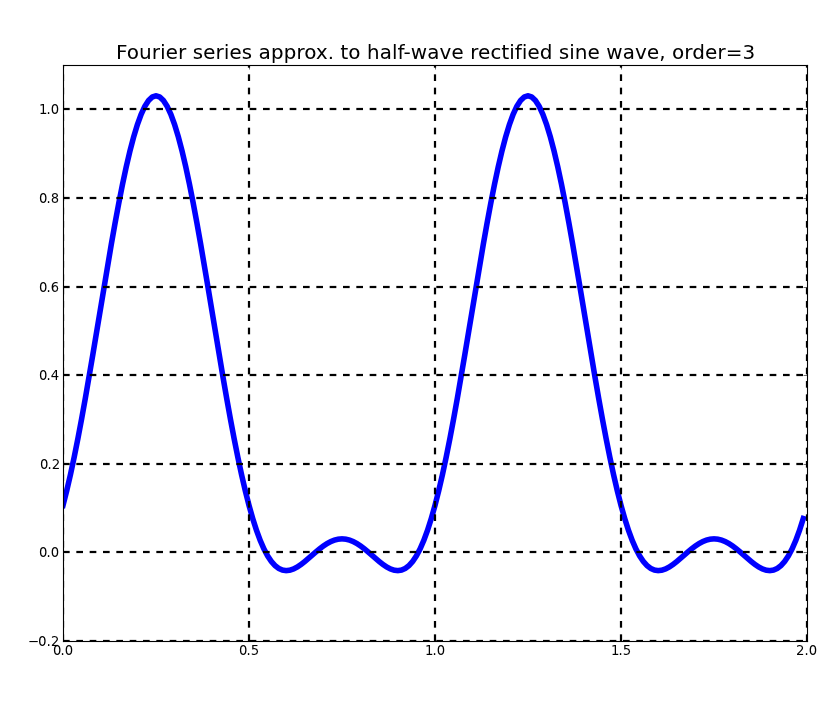
Fourier_series.py
This program demonstrates the use of the matplotlib graphical toolkit in conjunction with the Qt Graphical User Interface (GUI) API. matplotlib provides an extensive set of functions for generating various types of 2-D and 3-D graphics, but does not support user interaction. When writing a Python program that produces graphical output and must also handle user interaction (via keyboard and/or mouse), there are at least two basic approaches:
For simple user interactions, (1) is the preferred approach.
This program generates successive Fourier series approximations to a square wave, triangle wave, sawtooth wave, full-wave rectified sine wave, or half-wave rectified sine wave. Sample output appears below.
The program recognizes the following keys: